 TGFR Consulting LLC
 The Quality Function Deployment (QFD) process identifies of the CTQs (Critical to Quality) parameters that will form the basis of concept selection. These key performance parameters measure the ability of the concept to deliver on the VOC. This section details the steps required to develop a set of performance parameters and execute the QFD. The QFD process reduces the set of performance parameters to CTQs. This drives concept selection.
Performance Parameter Development
Parameter development maps a VOC statement to a minimum set of performance parameters or features. Specifically, a performance parameter adheres to the following definition
A performance parameter represents the definition of a tangible/measurable deliverable of the future product.
All Performance parameters are measurable, and the value of the parameter may be varied to enhance the overall impact of the parameter on customer satisfaction. The ability to vary the parameter value and change the way the parameter delivers on a user need represents the key discriminant for performance parameters. A feature may be important, but without the ability to vary the value, this feature cannot be a performance parameter to be used in the QFD process. The following summarizes this discrimination
All performance parameters are features, but not all features are performance parameters.
While developing performance parameters, avoid assuming an implementation. At this point in the process, a future product concept has yet to be defined. Performance parameters should not assume anything related to implementation. A key tool that can help with the development of an implementation free set of parameters is the standard fishbone diagram. A variation of a fishbone diagram facilitates the general mapping from a VOC or user need (the effect) to the features or performance parameters. These parameters feed into the QFD process. The fishbone process provides a general framework and structure around determining how features contribute to a user need.
This variation of the fishbone process drives the identification of the minimal number of features that influence satisfaction of the VOCs. This process follows the following steps
- Identification of the features delivering on the User need (the effect)
- Segregation of the features that are performance parameter statements
Feature Identification
Brainstorming identifies features directly contributing to a user need. At this point in the process, consider only features directly influencing user needs. Later in requirements design, other features are identified
Following the identification of the features linked to a user need, the process eliminates the attribute features. Attribute features do not have a range of values and are omitted from the final list of performance parameters. Save Attribute features for use in development of the final concept or design.
The following example shows a revised fishbone diagram associated with a VOC need
I need the patient to receive the exact prescription ordered by the doctor
The following figure shows the modified fishbone
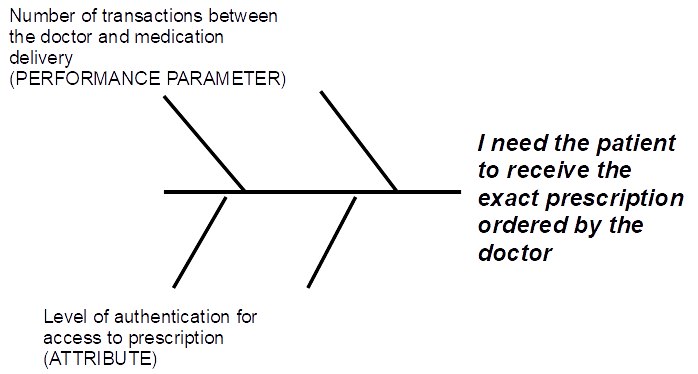
In this example the fishbone identifies two contributing features, “Number of transactions between doctor and medication delivery” and “level of authentication for access to prescription” . The “level of authentication for access to prescription” represents an attribute, as the parameter cannot be varied due to regulatory considerations. The performance parameter is “number of transactions” and the measurable range would be between 1 to 4 transactions.
For each VOC, a modified fishbone exercise collects all of the features. Often a single performance parameter contributes to several VOC statements and the next step in the process removes the duplicates and coalesces the parameters into a unique list. A similar process develops a unique list of attribute parameters, for use later in the evaluation of concepts.
Setting Up the QFD (Quality Function Deployment)
Following the identification of the performance parameters, construct a Planning Matrix as the first step in the QFD process. Much debate surrounds the level of complexity and detail associated with the QFD process, and this approach works at a simple level to identify the CTQs. The process detailed here focuses on performance parameter identification, and many of the other potential outputs of the process will be ignored. The following figure shows the basic structure of the Planning Matrix
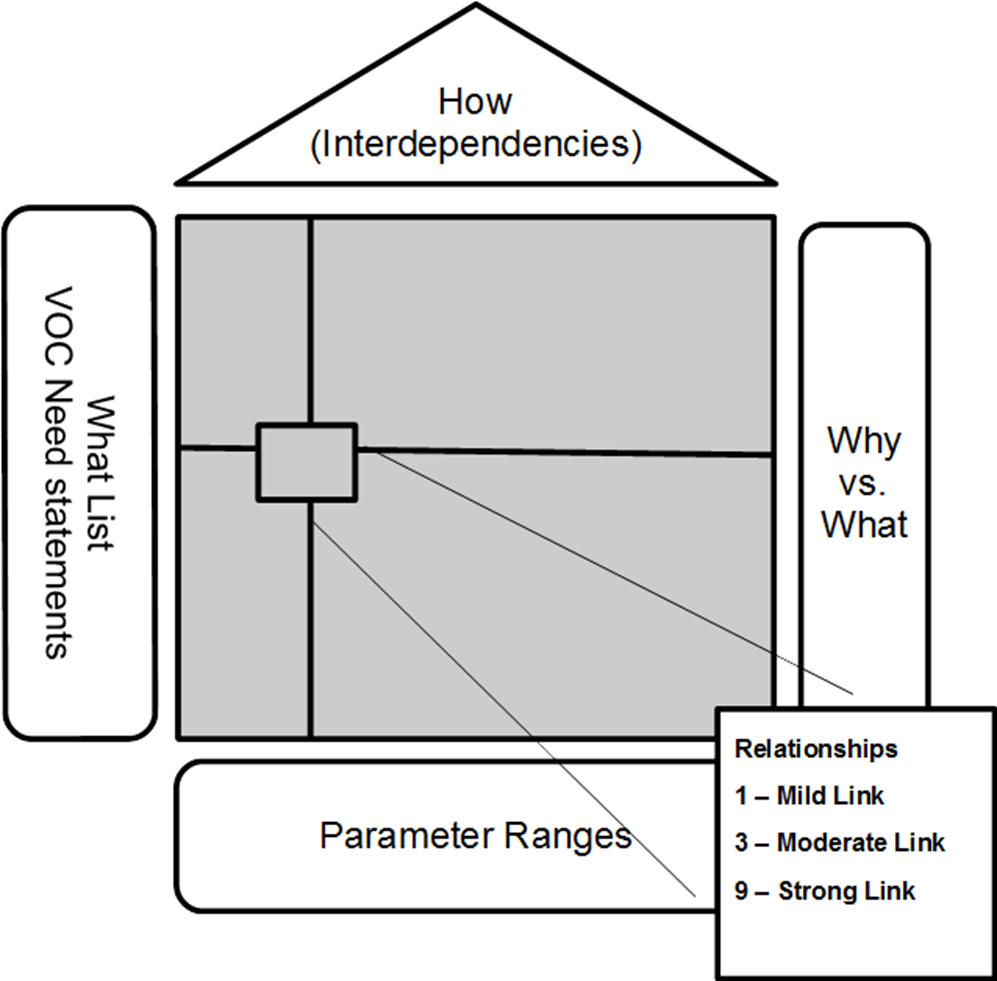
Within the Planning Matrix the mapping of the elements is as follows
- What List (rows) – the user needs (VOC). At this point in the process, the VOB is not considered.
- How (columns) – the performance parameters as developed. Initial ranges are developed.
The preferred structure of the Planning Matrix for CTQ identification is that every row has an importance rating, based upon a 1/3/9 rating scale. This 1/3/9 importance rating allows the easy discrimination of the key user needs. The use of a linear 1-5 scale is not recommended. A linear scale, compresses importance (everything tends to the same score) and compromises discrimination. With a 1/3/9 scale, the weighting favors the most important interactions. Take Care to limit the “9” weighting to 1-2 user needs, Otherwise a “Lake Wobegon” effect (all the children are above average) takes over and discrimination is lost.
Scoring the interactions of the features against the user needs scoring also uses 1/3/9 scale. The following definitions apply
- 9 – This performance parameter (feature) could, on its own, deliver 75%-100% on this issue/need
- 3- This performance parameter (feature) could, on its own, deliver 25%-75% on this issues/need. Other features will be needed to fully deliver on this issue/need
- 1 – This performance parameter (feature) has an effect of less than 25% on delivery of this issue/need
- Blank – This feature (performance parameter) has no effect on how this issue/need is satisfied
Identifying the CTQs
The standard QFD process involves moving the value of a performance parameter over its range and evaluating the changes in its ability to deliver on the user needs. Upon completion, the process has identified the most important performance parameters, and these parameters are the CTQs.
A QFD/CTQ process which results in identifying more than one or two CTQs may require adjustments to the weighting and interaction scoring. The identification of too many CTQs usually adversely impacts the selection of a concept and subsequent tradeoffs. In situations where the QFD process identifies too many CTQs, undertake a re-evaluation of the user need ratings and interaction scoring to reduce the set of CTQs identified.
As an example of a situation of conflicting CTQs, consider a QFD process for cell phones and other portable devices. In considering the CTQs for cell phones and other portable devices, the CTQs of light weight and long battery life tend to be in conflict. Review and re-execution of the CTQ process forces determination of exactly which of these performance parameters represents the CTQ.
The QFD process develops the CTQs for the device, but the results must represent a set of identified CTQs that the team and the business can agree represent the critical features. These CTQs must be clear and without conflicts that will impact the later concept selection activities.
Further Reading
| Topic | Reference |
| Fishbones | Fishbone (Ishikawa) Diagram. (n.d.). Retrieved from ASQ Knowledge Center: http://asq.org/learn-about-quality/cause-analysis-tools/overview/fishbone.html |
| Affinity Diagrams | Tague, N. R. (2004). QThe Quality Toolbox. In N. R. Tague. Retrieved from http://asq.org/learn-about-quality/idea-creation-tools/overview/affinity.html |